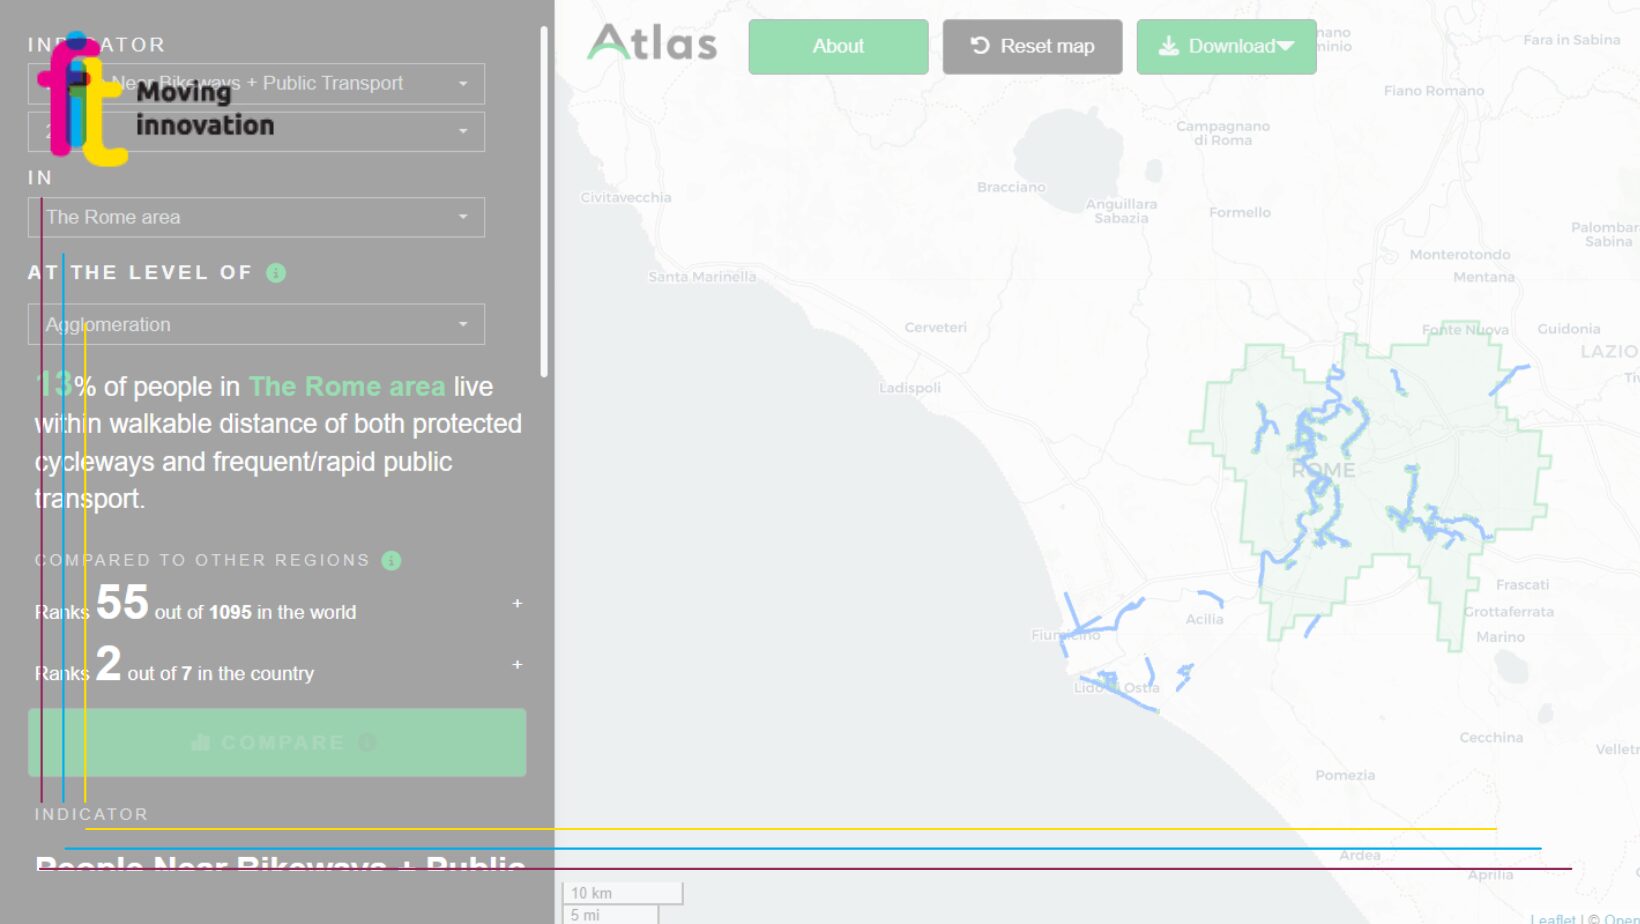
ITDP (Institute for Transportation and Development Policy) ha costruito l’Atlante del trasporto urbano sostenibile, una dashboard di dati online che visualizza indicatori di trasporto passeggeri urbano sostenibile e inclusivo.
The available data
The Atlas, based on open data sources, includes measurements of nine indicators for over 1,000 metropolitan areas, as well as measurements for over 40,000 jurisdictions and districts. These indicators include:
- Population density
- Block density
- People near protected cycle paths
- People close to services
- People near places without cars
- People safe from motorways (percentage of population not living near (within 500 metres of) a motorway)
- People close to frequent transport
- People in the vicinity of rapid transport
- People near cycle paths + public transport
ow the Atlas works To get started, simply select one of the indicators in the drop-down menu at the top. Next, you can select a city or country using the drop-down menu or by clicking on the map. Once you have selected a city, you can zoom in on it. Then, you can use the drop-down menu ‘At the level of’ to choose whether to display measurements for the conurbation, municipalities, districts or neighbourhoods. Different levels are available for different cities. You can also use the right-hand panel to activate or deactivate visualisation elements such as infrastructure lines or population density. Two of the indicators – People Close to Rapid Transport and Population Density – can also be explored for different years, starting from 1975. The other indicators are only available for 2024.
The data are published in the Atlas in open format, i.e. anyone can download them and can use them for their own research.
The Atlas will be updated regularly so that cities will be able to use it to keep track of their progress.
An example of the data available: the Rome Metropolitan Area Analysing the data available for the Rome Metropolitan Area, for example, shows that, on average:
- In 2024, 14% of residents live within 300 metres of a protected cycle path, ranking 138th in the world out of a total of 1095 and 4th in Italy.
More generally, 20 per cent of residents live within 300 m walking distance of any protected or unprotected cycle path. In the Rome area, in 2024, there were 152 kilometres of cycle paths, of which 111 were physically protected.
- 73% of the inhabitants of the Rome area live within 500 m of a transport stop where a bus or train arrives every 10 minutes or sooner, ranking 24th out of 1095 in the world and third in Italy. Overall, in 2024 there are 2634 transit stops in the Rome area where a bus, train or other vehicle stops at least every 10 minutes during the day.
- 35% of the people in the Rome area live within 1 km of a high-capacity public transport system on a dedicated line, ranking 53rd out of 1095 in the world and first in Italy. With regard to the metro, in 2024 the Rome area will have 60 kilometres of infrastructure; 34% of people within 1 km of a station.
To consult the Atlas, Click here.
Source: TTS Italy


